35+ Digital Advertising Statistics to Get Ready for 2021
2020 brought drastic changes to the strategies of companies all over the world. Marketing and advertising were affected a lot. It’s no doubt that the events of the year will be echoing in 2021.
The global crisis, lockdown, US elections, mass layoffs – we hardly ever experienced such levels of anxiety before 2020. The economic instability made businesses of all sizes adjust. Q1 and Q2 saw marketing budgets being cut and new projects paused.
But there were actually quite a few bright spots and great lessons. After recovering from the first shock, small businesses and enterprises started to revisit their strategies, and many were thriving.
Now, we know that building brand awareness and strengthening loyalty isn’t less important than investing in lead generation and sales campaigns. We know that brands can and should show empathy to customers. We know that the strength of small teams is their ability to pivot fast. We also know that the statistics and trends that 2020 brought should be considered by every marketer and advertiser willing to be successful in 2021.
- Business landscape
- Digital media spend statistics
- Advertising costs
- Advertising performance statistics
- Consumer behavior statistics
- E-commerce statistics
- Global social media trends
Business landscape
Before we move on to detailed statistics on advertising and marketing, let’s have a look at the state of the business landscape at the end of 2020.
-
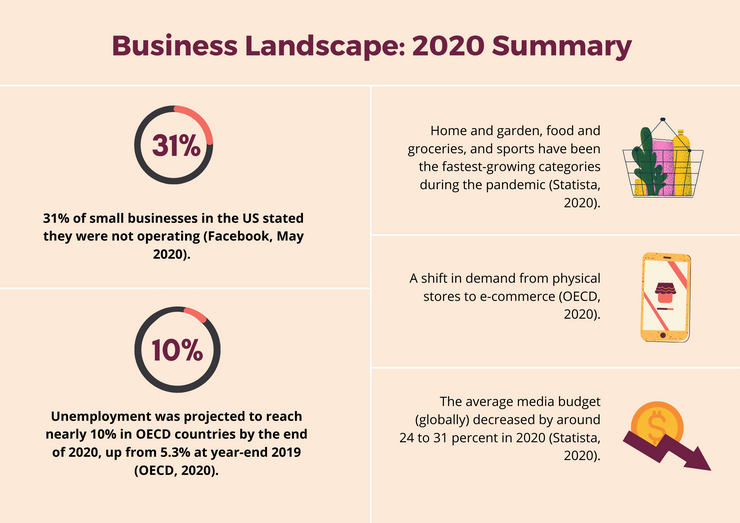
31% of small businesses in the US confirmed they were not operating in Q1 2020.
-
It was projected that unemployment in OECD countries would reach nearly 10% by the end of 2020, up from 5.3% registered at the end of 2019.
-
Home supplies, gardening tools, sports equipment, and groceries and foods appeared to be the fastest-growing categories during the 2020 pandemic.
-
In 2020, the pandemic has accelerated the shift in demand from physical stores to e-commerce.
-
Companies all over the world decreased the media budget on average by around 24 to 31 percent.
Advertising statistics
While it was predicted that advertising in all its forms would be affected seriously in 2020, digital advertising keeps growing. Consumers have doubled the time they spend online, which prompted businesses to pay special attention to digital advertising channels.
The effect the new trends have had on the advertising industry can be traced in the numbers below.
Media spend
Did the projections of the global media spend retraction come true? How were companies allocating their advertising budgets in 2020? Let’s see.
-
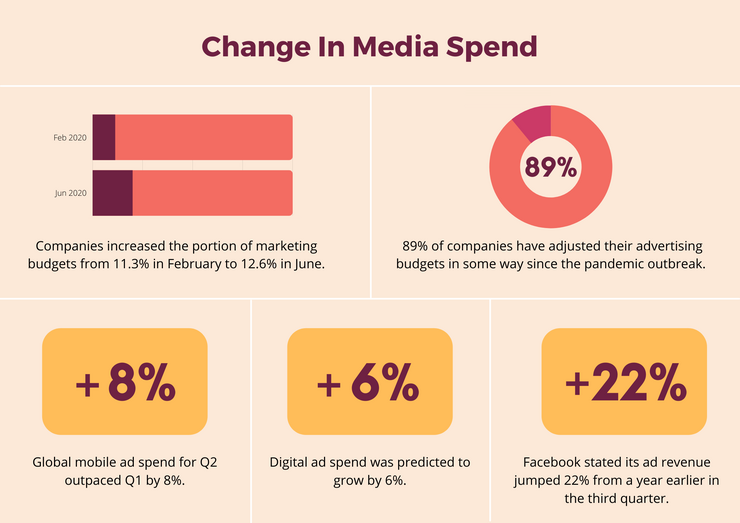
Companies have increased their marketing budgets as a percentage of the overall budget since the beginning of the outbreak. In February 2020, respondents were planning to allocate on average 11.3% of their budgets on marketing. By June 2020, the numbers rose to 12.6%.
-
89% of companies have adjusted their advertising budgets in some way since the pandemic outbreak.
-
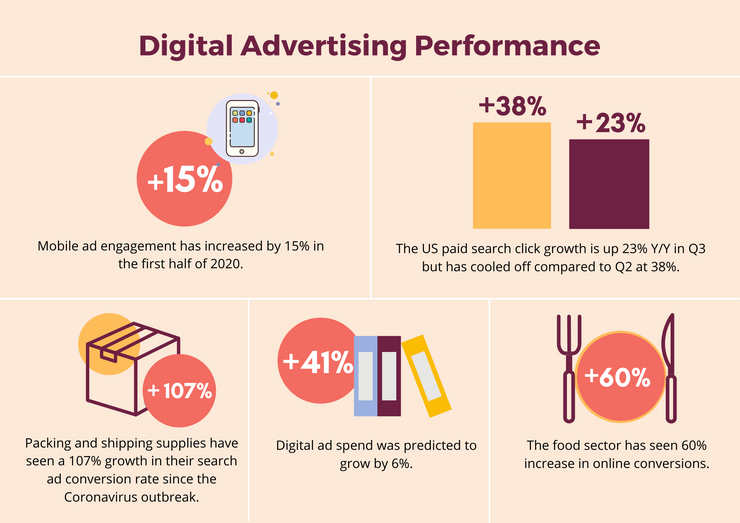
Despite the dip in traditional media, digital ad spend was predicted to grow by 6%.
-
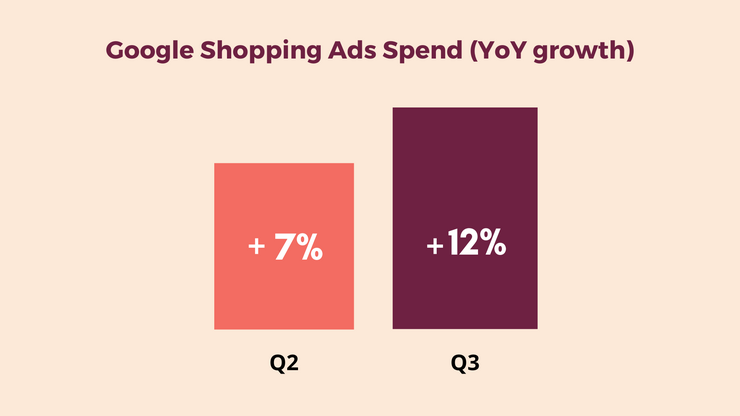
Spending on Google Shopping ads grew 12% year over year in Q3, up from 7% in Q2.
-
Even though many companies decreased their mobile advertising budgets in March and early days of April, it recovered more quickly than desktop advertising, growing rapidly through the end of Q2. Global mobile ad spend for Q2 outpaced Q1 by 8%, with mobile video being in particularly high demand.
-
Facebook informed its ad revenue jumped 22% from a year earlier in the third quarter.
Advertising costs
And what did digital advertising costs look like in 2020?
-
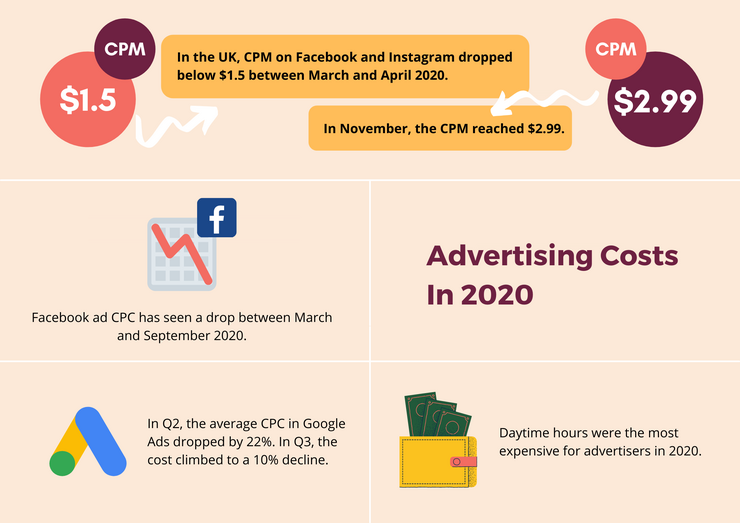
The panic among business owners and entrepreneurs resulted in global ad spend being decreased drastically in March. This caused lower Facebook advertising costs from March 2020 till September.
-
Daytime hours turned out to be the most expensive for advertisers in 2020.
-
In the UK, cost-per-mille (CPM) on Facebook and Instagram dropped below $1.5 between March and April 2020. Since May, the CPM has started to climb consistently again, reaching $2.99 in November.
Advertising performance statistics
Companies in different industries have been seeing a drastically different performance of their advertising campaigns. As you’ve seen in one of the infographics above, demand in categories like delivery and shipping has been particularly high (and will remain at similar levels in 2021), while travel and leisure are still in survival mode.
The statistics below illustrate how all the massive changes are reflected in advertising performance in various sectors.
-
As brick-and-mortar retail has focused on operating online, packing and shipping supplies have seen a 107% increase in search ad conversion rate since COVID-19 began.
-
Due to the remote work growth, search ads promoting home office supplies have been performing exceptionally well. Google ad clicks increased by 35%, with conversion rates up by 41%.
-
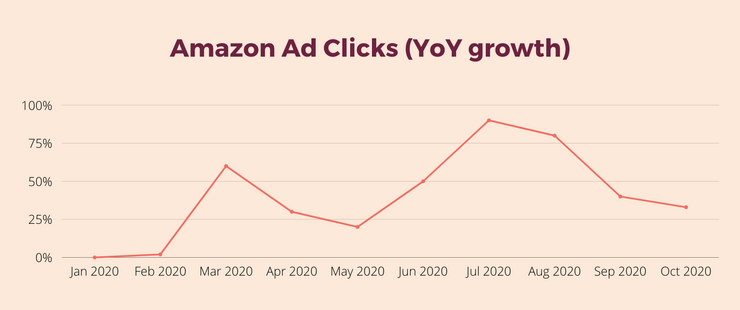
In September, Amazon ad clicks were 31% higher than in January.
-
As a result of the increased demand for online grocery shopping, the food sector has seen a 60% increase in online conversions.
On-Demand Video Course On Native Advertising
Boost your ROAS with native ads. Enroll now with our limited 30% discount.
-
Mobile ad engagement has increased by 15% in the first half of 2020.
-
The US paid search click growth is up 23% year over year in Q3. However, compared to Q2 at 38% caused by pandemic-related activity online, the growth has cooled off in Q3 2020.
Consumer behavior statistics
2020 accelerated behavioral shifts among users were accelerated. Businesses of all sizes have learned the lesson – if you don’t build an online presence, you don’t exist.
-
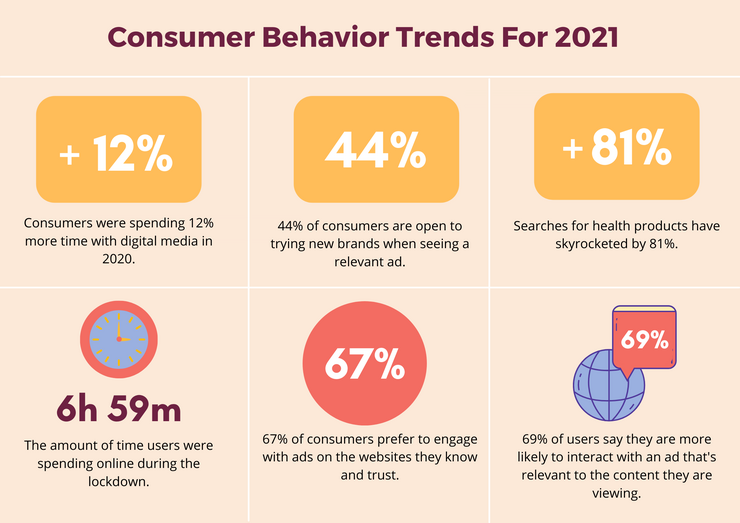
Compared to previous years, consumers were spending 12% more time with digital media in 2020.
-
Consumers have doubled the amount of time they spend every day interacting with online content — from the average 3 hours 17 minutes to 6 hours 59 minutes. Searches for health products have skyrocketed by 81%.
-
44% of consumers are open to trying new brands after they see and click a relevant ad alongside content they’re viewing.
-
67% of consumers prefer to engage with ads on the websites they know and trust.
-
69% of respondents say they are more likely to pay attention to an ad relevant to the content they are viewing.
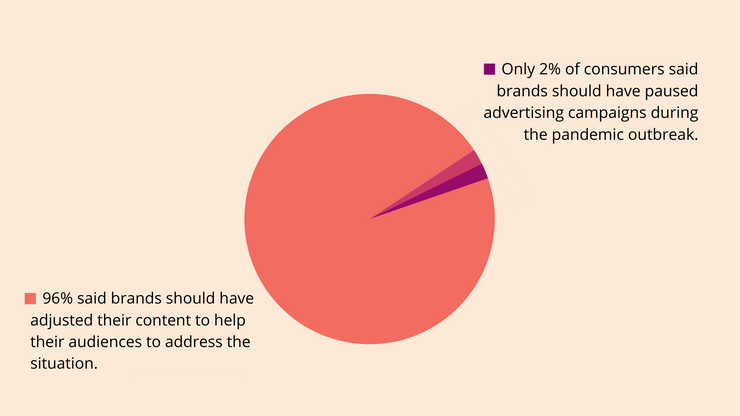
- Only 2% of consumers said brands should have paused advertising campaigns during the pandemic outbreak. Still, 96% said brands should have adjusted their content to help their audiences to address the situation.
E-commerce statistics
-
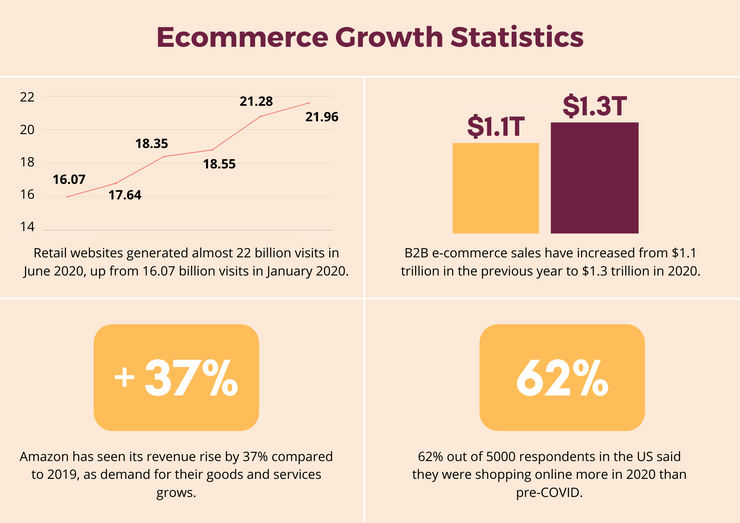
Amazon has seen its revenue rise by 37% compared to 2019, as demand for their goods and services grows.
-
Retail platforms have seen unprecedented growth in global traffic between January 2020 and June 2020. The numbers surpassed even holiday traffic peaks in 2019. Overall, retail websites generated almost 22 billion visits in June 2020, up from 16.07 billion visits in January 2020.
-
B2B e-commerce sales have increased from $1.1 trillion in the previous year to $1.3 trillion in 2020.
-
62% out of 5000 respondents in the US said they were shopping online more in 2020 than pre-COVID.
Global social media trends
-
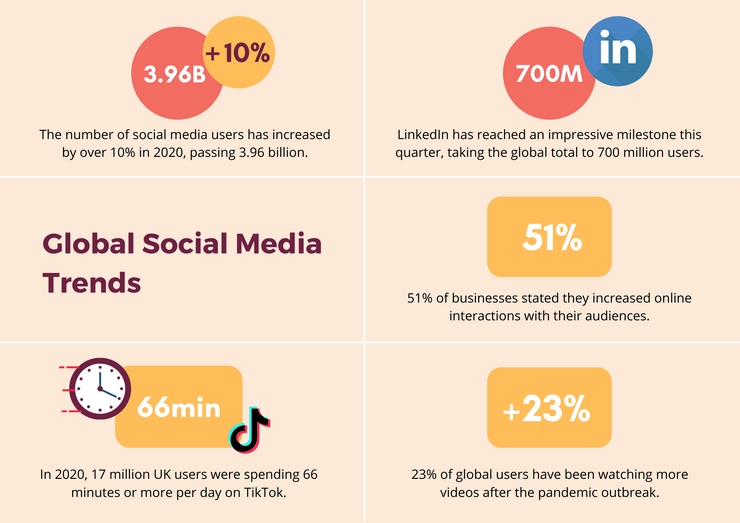
The number of social media users has increased by over 10% in the past year, passing 3.96 billion by the start of July 2020.
-
LinkedIn has reached an impressive milestone this quarter, taking the global total to 700 million users.
-
51% of businesses stated they increased online interactions with their audiences.
-
In 2020, 17 million UK users were spending 66 minutes or more per day on TikTok.
-
23% of global users have been watching more videos after the pandemic outbreak.
Sources:
- State Of Small Business Report
- OECD Report
- COVID-19 impact on the fastest-growing categories
- E-commerce in the time of COVID-19
- The statistics on decreased media budgets in the first half of 2020
- Coronavirus marketing and ad spend impact
- AdExchanger
- Digital marketing report
- Global mobile ad spend report
- Google, Facebook, and Amazon statistics
- Understanding Facebook Ads cost: 2019 & 2020 Benchmarks
- Value of Facebook and Instagram CPM
- The Small Business Guide to COVID-19
- Assessing Ad Relevance: May 2020 Snapshot
- Four fundamental shifts in media and advertising in 2020
- The five most searched products during the pandemic
- Advertising during the COVID-19 outbreak
- Amazon.com Announces Third Quarter Results
- COVID-19 effect on e-commerce website traffic globally
- Coronavirus and e-commerce
- Digital 2020: July Global Snapshot
- COVID-19’s Impact on Social Media Usage
What’s next for 2021?
In 2020, e-commerce has grown rapidly, consumer behavior has started to shift, and online content consumption has reached unprecedented numbers. Most of these trends are set to continue post-pandemic. That’s why it’s essential that you are aware of every change related to your industry and build your marketing strategy on trends that matter.
Joinative agency is ready to build a strong advertising strategy to help your business navigate through 2021. Get in touch with our team today.

 Feed
Feed


