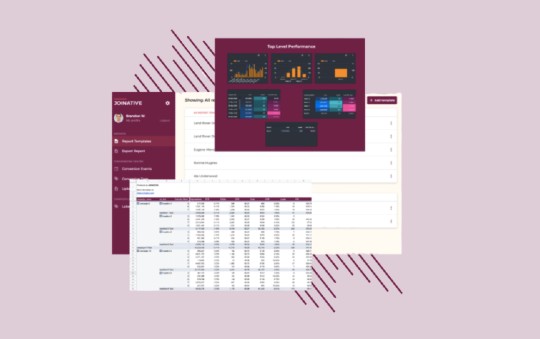
Why Do Advertisers Use Joinative’s Native Advertising Management Platform?
The variety of native advertising platforms lets advertisers select exactly the ones that will work for them.
Instead of limiting native advertising campaign reach by using one platform, experienced advertisers often choose to use several platforms at once. Thus, if you built a successful Taboola campaign, it’s absolutely worth adding another platform, such as Outbrain, to increase your reach significantly. The greater your reach, the more you can scale your performance. However, along with multiple benefits this combination may offer, it also has its serious challenges. Here are just a few examples:
- Tracking the performance for multiple campaigns across different platforms is a challenging and time-consuming task.
- Reporting data isn’t structured in the way you need it, forcing you to export and manage reports manually.
- You get either little or no information on what is working well across campaigns and networks.
If you want to monitor your campaigns on both platforms and don’t want to waste your time exporting performance reports manually, Joinative’s Native Advertising Management platform is right for you. Our Native Pro service provides cross-platform reporting, rule-based optimization, alerts and data structuring for both Taboola and Outbrain campaigns.
Read on to learn how advertisers benefit from using our reporting tool and what’s in it for you.
Have the data for Taboola and Outbrain campaigns in one place
How much time does your entire team spend to export daily performance reports per week? Something between three and five hours? What if they could spend this time more effectively?
When you run several campaigns across Taboola and Outbrain, it’s important to understand how every platform performs for this or another campaign. To compare performance data for every platform, you had to download every report separately and bring them together manually. With Native Pro, you don’t need to do it anymore.
Do you want to check out Native Pro benefits yourself? Contact us, and we’ll create a free account for you to test the tool.
How do you download your first report?
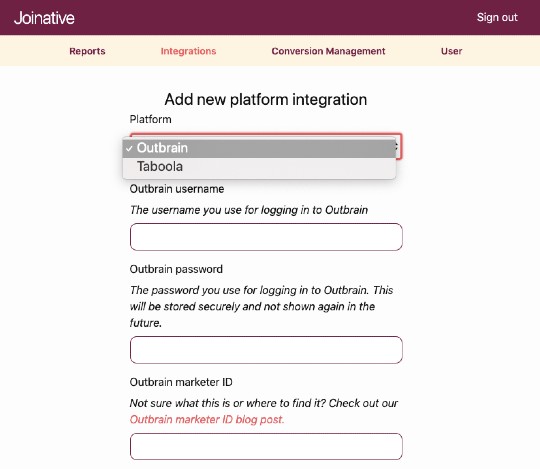
First, you need to connect your Taboola and Outbrain accounts to Joinative. To do it, go to the Integrations section.
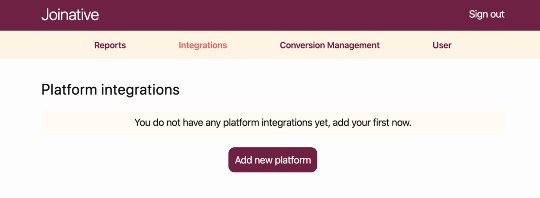
After you click the ‘Add new platform’ button, you’ll need to select the platform to integrate and fill in the relevant account details.
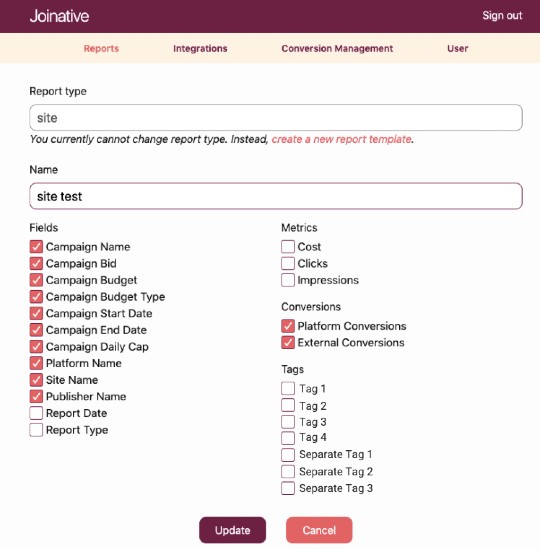
When you connect your account(s), you can go to the Reports > Report Templates section to select the type of report and the fields you want to export. We’ll go with the ad report now and come back to the site report in the next section.
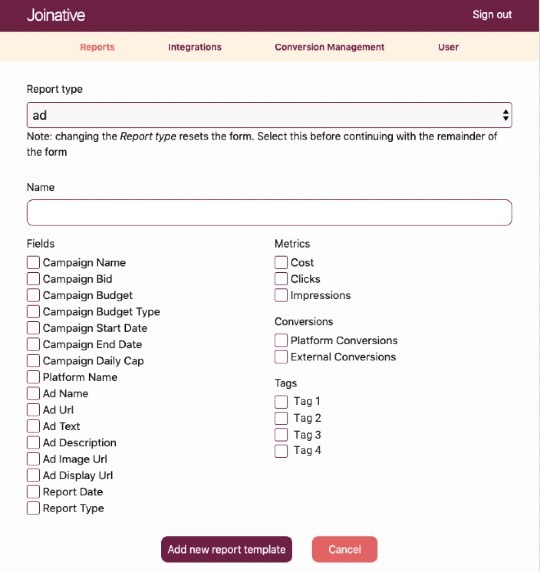
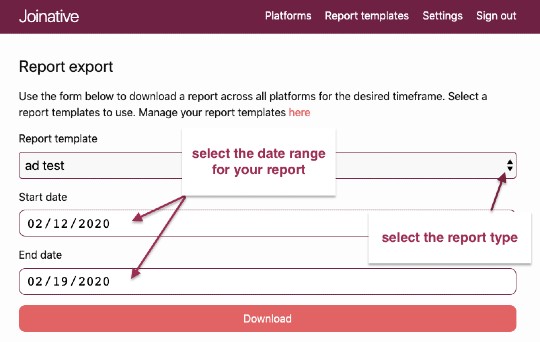
Here you select the fields and metrics you would like to get when exporting the report. After selecting the relevant fields, go back to the Reports section and click on Export Report.
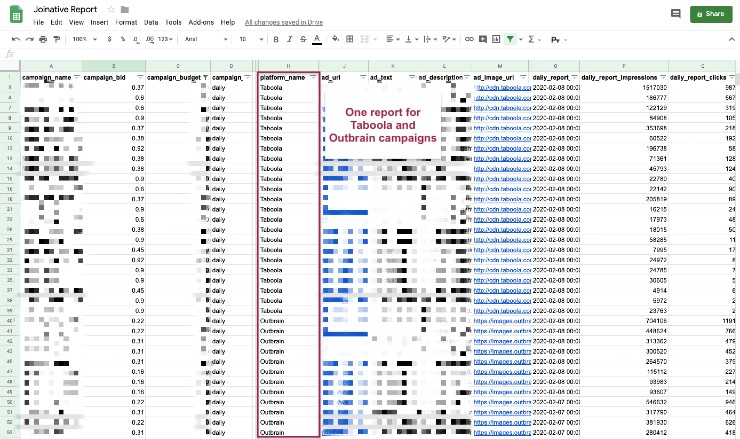
A few minutes spent on setup, and you get a CSV file with the important performance data for all your campaigns in one place. As you won’t need to configure your profile details for future reports, the whole process will take no time.
While the report you get might contain too many rows, we recommend that you structure the data using Pivot tables. If you haven’t worked with them previously, this guide will introduce you to the topic.
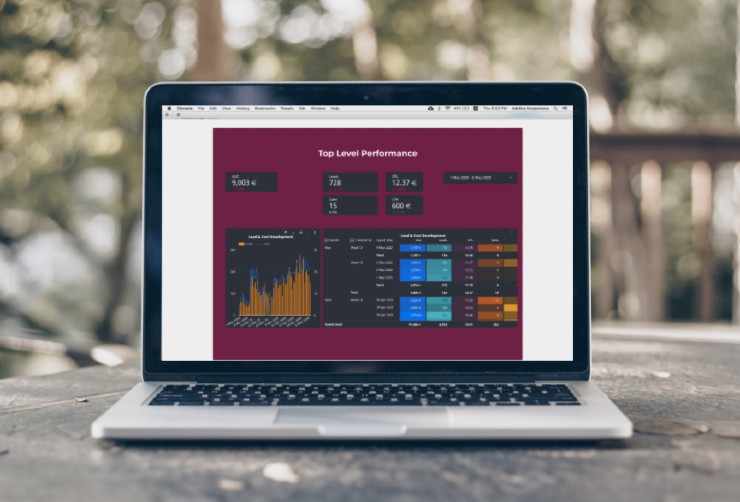
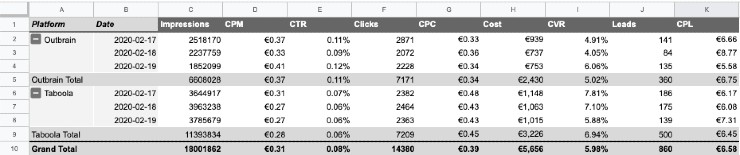
We decided to compare how all our campaigns perform on Taboola and Outbrain on different days. Here’s what we’ve got:
Structure data and analyze your performance from different angles
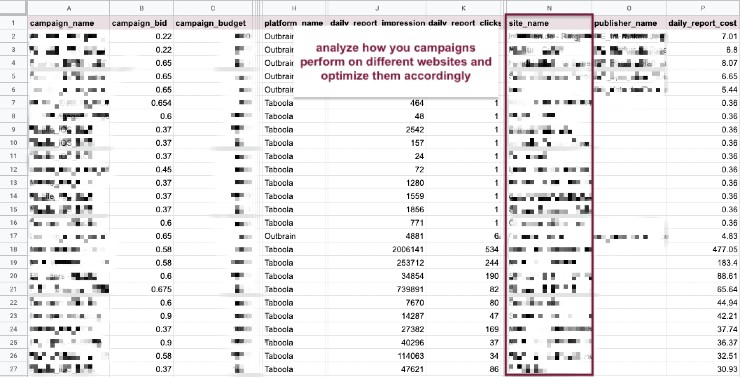
Native Pro lets you see how your campaigns perform on different websites.
Are there campaigns that get lots of clicks but hardly ever result in conversions? Not to waste your budget, you’ll want to check out what publishers you get clicks from. Maybe, specific campaigns perform particularly well on specific websites? With our report, you’ll find out which sites perform better for you and then focus on the right ones.
To get the site report, proceed to Report templates, create a new template, and select the ‘site’ report type this time. Again, you can check the fields that will be listed in your report.
When you’re ready, go to the Export Report section and download the report.
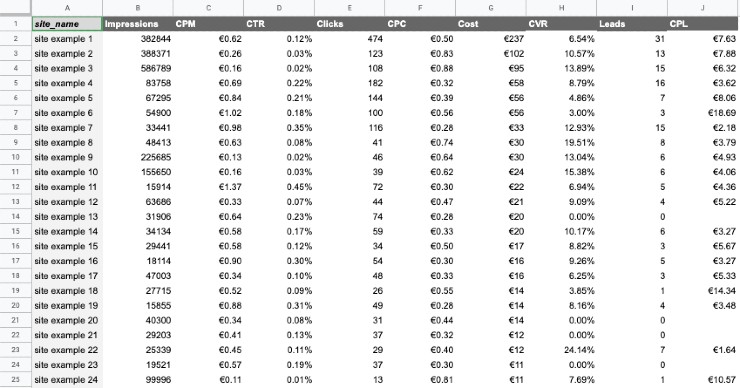
Now it’s time to get the most out of the data with Pivot tables. Just select the values you want to compare, and you’ll get a customized and informative report. This time, we’re checking which sites deliver the best performance across all the campaigns and which sites should be excluded.
To learn how to make the most of Joinative’s reports, sign up for our newsletter to receive follow-up posts.
On-Demand Video Course On Native Advertising
Boost your ROAS with native ads. Enroll now with our limited 30% discount.

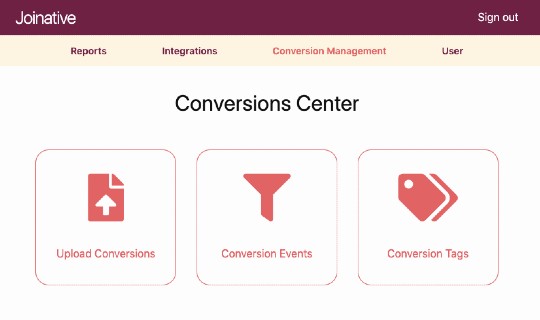
Conversion management
Our highly customizable conversion tags allow you to group and combine conversions and better understand your traffic performance.
Upload conversions and boost your confidence in the data
The conversion data inside of Taboola and Outbrain (or advertising platforms) often fails to perfectly match up with the data you see in Google Analytics or a custom BI solution. And not having the relevant and up-to-date conversion data, you can’t correctly interpret the campaign efficiency.
With Native Pro, you can consider and compare all the data at your disposal and make the right decisions about your native advertising campaigns.
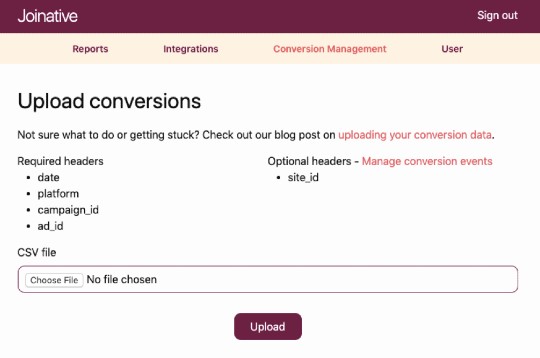
Our Upload Conversions feature allows you to upload conversion data from your internal tools right into Joinative. All you need is to have a CSV file that includes the following fields:
- date (in YYYY-MM-DD format) - which date do these conversions correspond to;
- platform - the platform that a campaign or ad belongs to (note: this is necessary in order to match the correct ads and campaigns in Joinative);
- campaign_id - the ID of the campaign for which the conversion happened (this must be the ID as the platform records it);
- ad_id - as above, the ID of the ad for which the conversion happened.
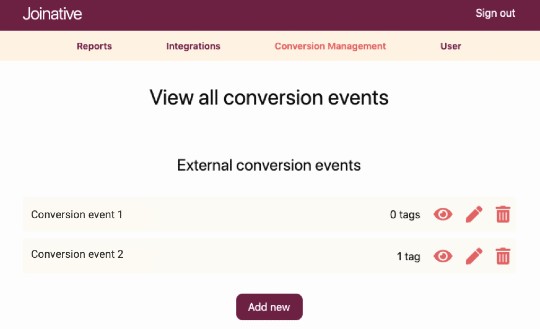
From now, you’ll have all the conversion events defined in the file in the Conversion Events > External conversion events section. Let’s move on to learn more about External and Platform conversion events.
Conversion events
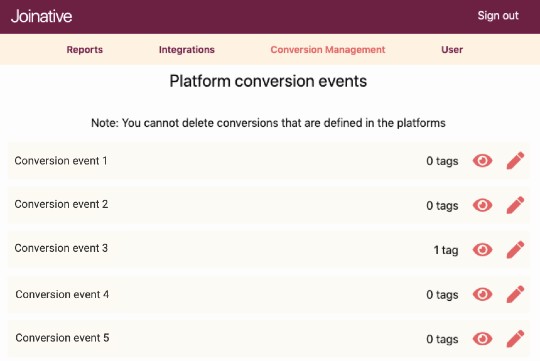
In the Conversion events section, you’ll see both External conversion events (the ones you uploaded yourself) and Platform conversion events (the ones you have in Taboola and Outbrain).
Create conversion tags and combine conversion data
This is our favorite part of the Conversion management feature…
When you’ve added all the conversion events you want to track, you can move on to creating Conversion tags.
Note: If you don’t want to use external conversion data, you can skip all the previous steps and move on to this one right after you integrate your account with Taboola and Outbrain.
How do Conversion tags help?
First and foremost, they allow you to organize conversion data the way you want. Having a bunch of conversion events in one report isn’t convenient when it comes to data analysis. With our Conversion tags, you can group conversion events and apply different report methods to either see the total for all the conversion events you’ve tagged (tags to aggregate conversions) or single out specific conversions in separate columns (tags to spread conversions).
So, to see how your audience converted along the funnel that includes a few steps, you might want only the relevant conversion event to be displayed side by side in separate columns. But what if you have three similar funnels (for instance, when you target three countries sharing one language) where audiences take the same steps? In this case, the ‘show total’ method will come in handy – you can group conversion events for three funnels all together.
When you create a new tag, you’ll need to give it a name, select the report method (‘show total’ or ‘show individual columns’) and select conversion events you want to group.
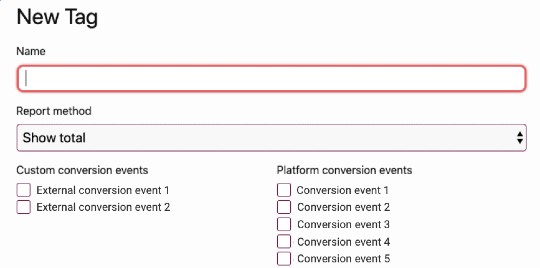
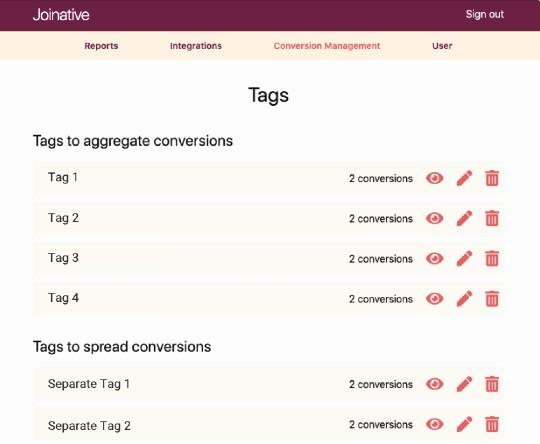
Depending on the selected report method, you’ll see a new tag appear either below the Tags to aggregate conversions section or below the Tags to spread conversions section.
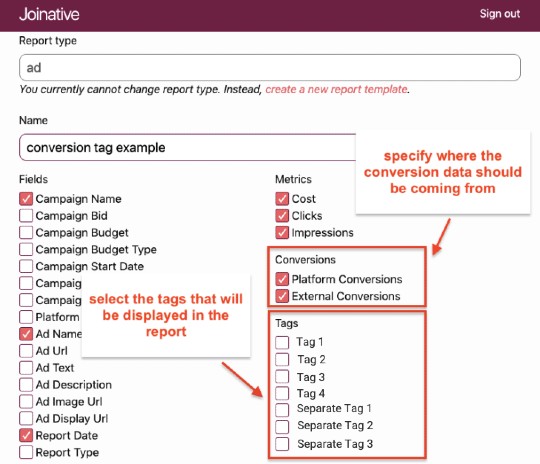
Finally, you can go to the Report templates section and either create a new report or edit the existing one(s) to specify the tags that will be displayed in the report.
The resulted report will contain the performance and conversion data structured the way you want. To work with the data effectively, we’ll go with Pivot tables again.
We’ll go through the steps you’ll need to take to create a report to analyze how your campaigns perform at different funnel stages.
- Create conversion events for different funnel steps and upload the data on them (if not available in the platforms).
- Create a conversion tag that selects these conversions events and use the “show individual columns” report method.
- Select this conversion tag in the relevant report template and export data.
- Create a pivot table. You can select to separate the data by platforms, campaigns, ads, sites, etc.,
- Use conversion events as values in the pivot table.
- Add calculated values, where each funnel step (conversion event) is divided by the previous step. This will calculate the % of people who make it to the first step.
- Add a calculated value dividing the number of people who converted (in our case, these are people who made it to the last question and answered it) by the number of people who clicked on the ad. This will let you see which funnel, version, campaign etc. is more effective overall.

What can be concluded from this report?
While the CVR for Outbrain and Taboola is almost the same (1.91% and 1.88%), the behavior in the funnel is very different. Although people coming from Outbrain ads are more likely to enter the funnel, most of them won’t go through all the steps. While visitors from Taboola campaigns aren’t so willing to start the survey, they’re more likely to complete it once they started. Based on these insights, you can decide how to optimize your funnel for better results. For instance, we saw that we’d need to test different landing pages for Taboola campaigns to improve click-to-survey rate. For Outbrain campaigns, fixing the first question and the final step of the survey could help, as these were the steps where most people dropped out.
Receive alerts on your campaign performance and fix issues promptly
Have you ever thought how great it would be to get alerts when your campaigns don’t perform as expected? This would let you react promptly and stop spending your budget on campaigns that don’t result in any conversions. Good news – trigger alerts feature is on the way.
Just define the rules specifying the event you want to be alerted to and how you want to receive these alerts. A webhook will deliver messages on slack, email, WhatsApp, or whatever option you prefer. You can also create a task in a project management tool like Asana, Trello, Jira, etc. You’ll receive alerts every time your rule conditions are met. Don’t miss your chance to receive timely notices of performance issues needing your attention.
This feature is under development at the moment, but you’ll be enjoying it soon!
Test Native Pro today
Native Pro is a reporting and optimization tool developed to make data-driven marketers’ routine easier. With this platform, you’ll build better campaigns, making the most out of your budget.
Do you want to run your native advertising campaigns smarter? Get your test account and start saving your time today.
What’s next? More unique features are yet to come. Subscribe to our newsletter to receive updates and actionable tips. Follow us on LinkedIn and Twitter to keep abreast of all the native advertising news and product updates.
If you think of any features that would make Native Pro better and help you optimize your native advertising efforts, drop us a chat message or contact us at hello@joinative.com.