Taboola Benchmarks for Your Industry in 2021
Regardless of your experience in native advertising, you’ll always need to keep up-to-date on industry trends and changes. And as the campaigns for different niches perform differently, you can’t just apply general best practices and wait for some results.
Whether you’re about to launch your first campaign or you’ve been in native advertising for years, you’ll want to know what are good metrics for your niche and how your campaigns perform against your competitors.
To help their users run better campaigns, Taboola regularly publishes reports with insights on campaign performance, best practices, and targeting benchmarks across all industries.
We at Joinative decided to compare how campaigns for different niches perform and collected Taboola’s benchmarks for different niches in one place. In the post, you’ll find data for the following niches:
- Education
- Auto
- Technology
- Fashion & Beauty
- Finance
- Travel
- Food
Let’s see what we got.
Note: The Taboola benchmarks below are taken from Taboola ebooks. Data is available here: Technology benchmark report, Food benchmark report, Auto benchmark report, Travel benchmark report, Education benchmark report, Finance benchmark report, Fashion & Beauty benchmark report.
CTR
Of course, one of the most interesting metrics for advertisers is a click-through rate. What’s an average CTR across the above-mentioned industries?
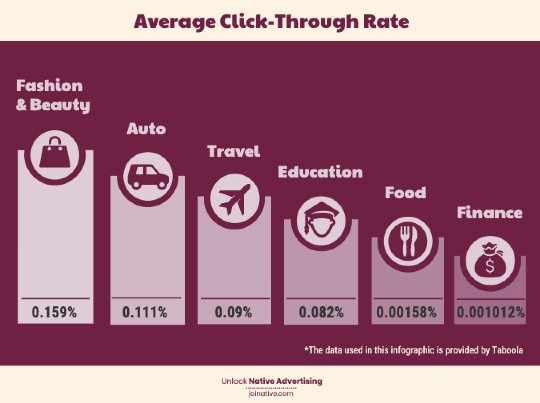
You should remember that this is the statistic on the average click-through rates, not on the best ones. In the further sections, you’ll find the best practices to follow if you want to deliver better results.
Content type
Promoting text-based content is a widely-used technique for advertisers, and for good reason – people love useful articles. On the other hand, all the industry experts claim that videos will be on the rise for a long time and strongly advise to focus on this content type.
What is your low-hanging fruit? The following infographic illustrates two graphs per each industry – the left one shows the supply of the related content type, namely, how much advertisers spend to promote it, and the right one depicts the demand for it, namely, CTR.
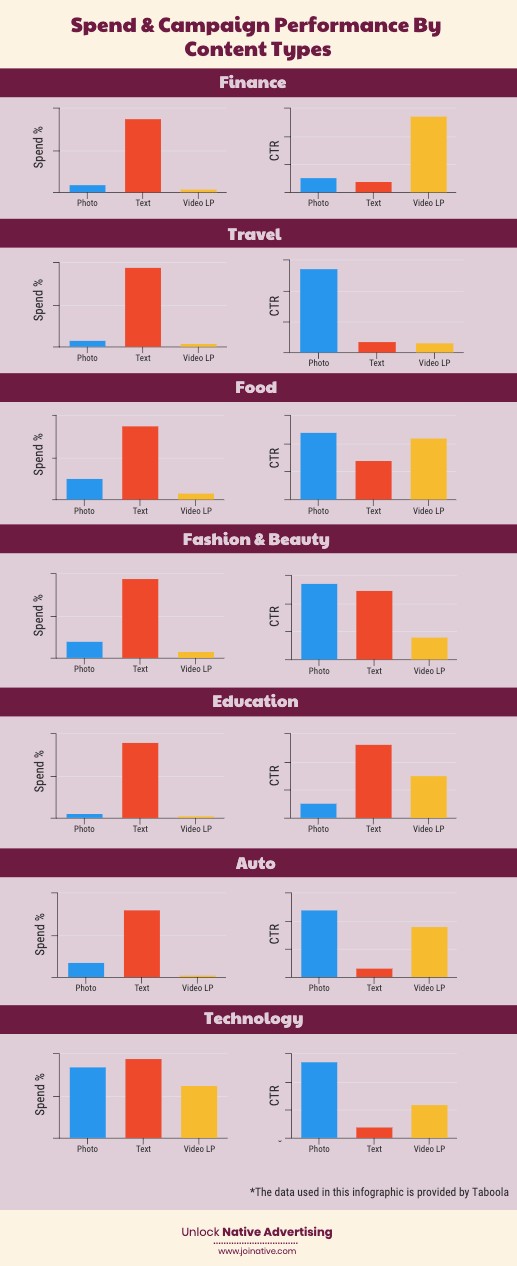
You see that every type of content performs differently depending on the niche. One thing for sure, marketers should think of shifting the focus from promoting text-based content solely. While most advertisers ignore landing pages that include videos, they could significantly improve their campaign performance by investing more in this content type.
Device
Most platforms let you choose the devices your campaigns will be displayed on. Splitting your campaigns by device types, you can reduce CPC (mobile campaigns usually cost less), embrace demographic differences, and optimize your campaign items for the specific devices.
But how do you know which devices you should focus on? Check out the graphs illustrating device performance for various niches.
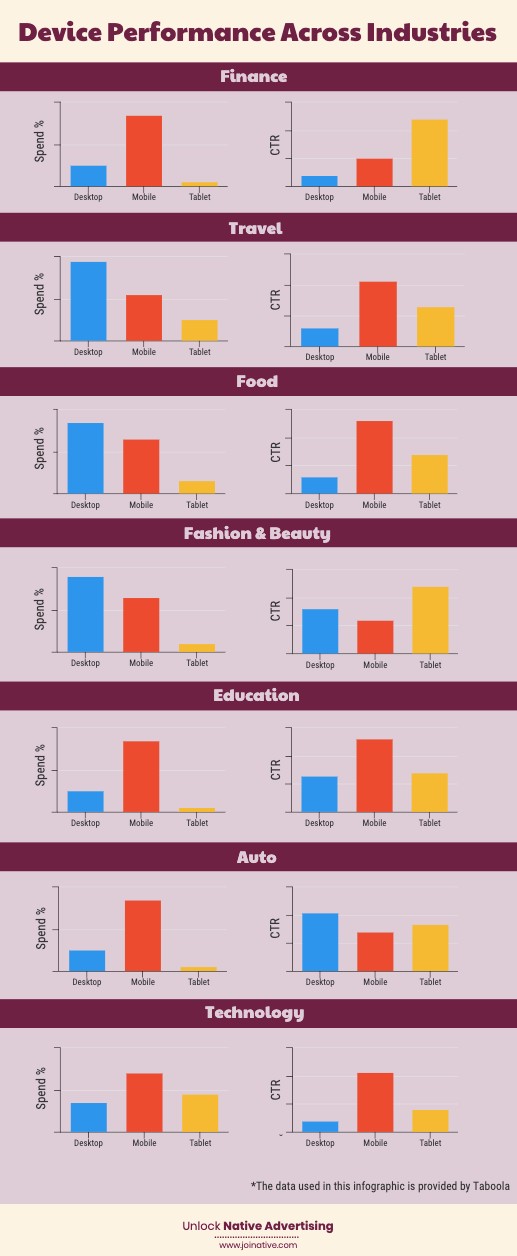
While most of the traffic is coming from mobile devices, some industries, such as Fashion & Beauty, Food, and Travel, haven’t adjusted their targeting strategies to this trend yet.
Master Advertising On Taboola
Register for the ultimate native advertising course and get exclusive insights into building successful Taboola campaigns.

Time
When you set up your native advertising campaign, you can select the days and times you want your ads to be displayed. Knowing when your audience is the most active, you can split your campaigns and adjust your bids to increase the visibility of your ads during this time.
Let’s look at the best-performing days of the week for every industry.
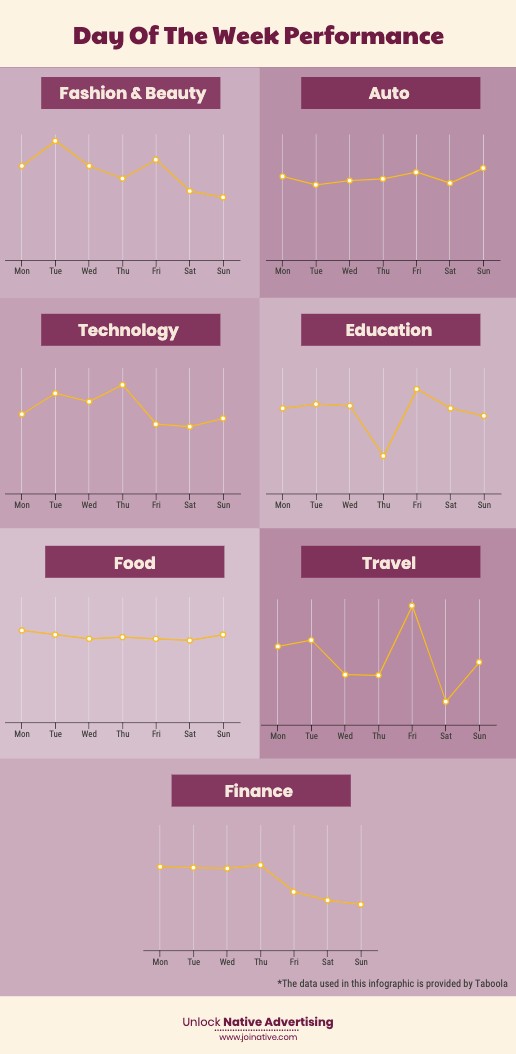
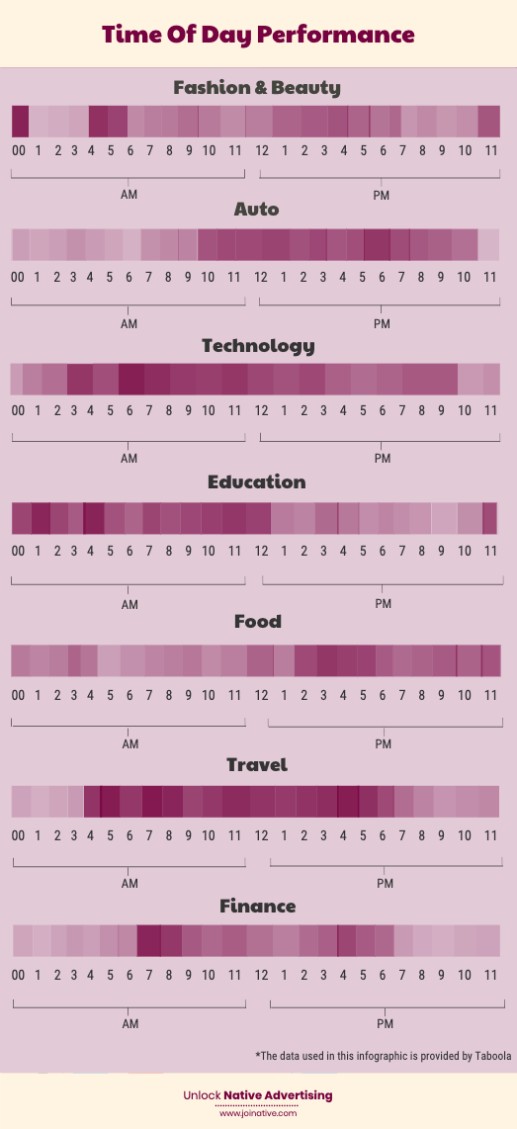
In these graphs, you see how the average CTR varies depending on the day of the week. Being active during the first days of the week and on Fridays, most users put aside their laptops on weekends. Now, we’ll figure out when your campaigns are the most effective throughout a day.
Ads
With a compelling ad, you’re halfway to success. It would be great if you knew which images and keywords perform best across different platforms, categories, or languages, wouldn’t it? You might be glad to know Taboola offers these insights to everyone.
Taboola Trends is a data tool that features up-to-date behavioral trends that vary depending on image and keyword variables. If you check these data, you’ll see that what is considered to be the best practice for one niche is completely unsuitable for another one.
While you can find the real-time data and get more specific with the details of your campaign on Taboola’s website, we combined the most interesting insights for our industries into one infographic.
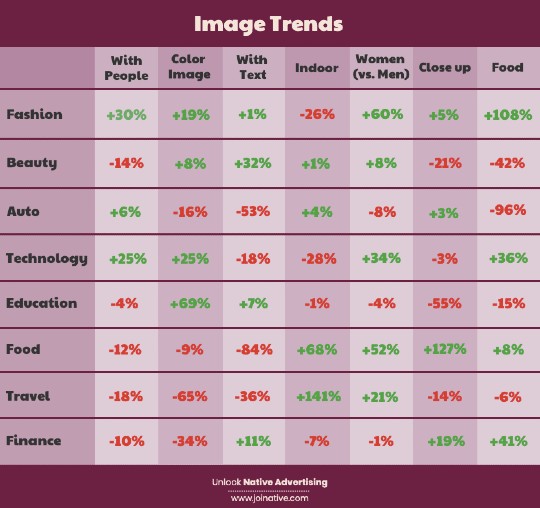
Images
Here you can see how different image characteristics affect the CTRs of ads across different industries. For instance, the ‘+30%’ mark at the intersection of ‘Fashion’ row and ‘With People’ column will mean that images with people result on average in 30% higher CTRs.
Key findings
- The campaigns for the fashion & beauty industry have the highest average CTR across all industries, while finance-related campaigns have the lowest demand among users.
- The start and end of the week can be your high-opportunity time.
- Some campaigns perform exceptionally well at late night hours.
- While it’s commonly accepted that images with people are more effective, the statistics show that it’s not always the case.
- In most cases, images with women get a higher CTR than the ones with men.
- Remember that these trends won’t guarantee you the same results, but it’s a good place to start for people who want to optimize their campaigns towards attracting more users and increasing CTRs.
Were you surprised by the insights? Will you use the data when setting up your next campaign?
The data will help you not only run more effective native advertising campaigns but also better understand your audience’s preferences and behavior in general. We hope you enjoyed reading the post! Follow us on Twitter and LinkedIn for more actionable tips and stats.
Are you running campaigns on Taboola or Outbrain (or both)? With Joinative’s Native Advertising Management platform, you’ll monitor your campaigns on both platforms and stop wasting your time exporting performance reports manually, Native Pro provides cross-platform reporting, rule-based optimization, alerts and data structuring for both Taboola and Outbrain campaigns. Book a free demo today.
Are you just about to start your native advertising journey? We’re here for you. With our native advertising consultancy services, you’ll get useful insights and instructions from our team and learn how to manage effective native advertising campaigns.