How to Work with Our Free Advertising Report Templates
Reporting is the most time-consuming and tedious part of an advertiser’s daily routine. Whether you’re working for a client or running native ad campaigns in-house, you must have already spent plenty of time building regular reports.
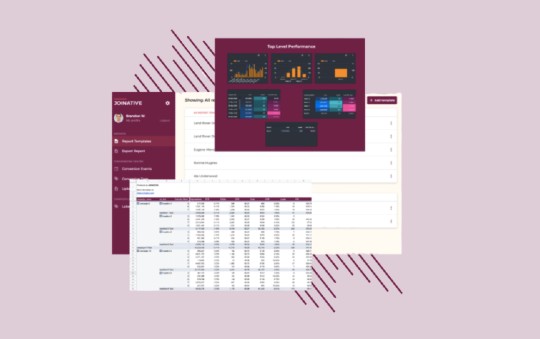
When developing our Native Pro platform, we were driven by the desire to make native advertising reporting and optimization easier for everyone. And we believe we’re on the right way – the tool already allows advertisers to export informative reports for all their campaigns across two platforms, customize them, and use this data to improve campaign performance. But we couldn’t stop at this. To enable you to create ready-to-use reports and analyze your campaigns from different angles in exactly three clicks, we’re sharing this Free Native Advertising Report Templates Collection with you.
Note: Before you start using the template, make sure to make a copy and follow our instructions.
About our Native Advertising Report Templates
This spreadsheet with multiple report templates was developed for you to enjoy the features of Native Pro, not having to adjust the data it delivers to you.
However, if you aren’t a Native Pro user, you can also use these templates after you make your platform reports fit (for formulas to work correctly, the columns of your own reports should correspond to the columns of Joinative’s reports). Alternatively, you can start your free 30-day trial of Native Pro today and see for yourself how much time it helps you to save.
Here’s what you can do inside of the spreadsheet:
- Review overall performance
- Compare overall native advertising performance by platform
- Get comprehensive reports on campaign performance split by platforms
- Review the performance of individual ads
- Exclude sites that waste your budget
- See how your audience converts along the conversion funnel
How to start using the templates?
Before we move to the overview of the report templates, let’s quickly go through the process of adding your own data to the spreadsheet.
After you open the spreadsheet, make a copy of it.
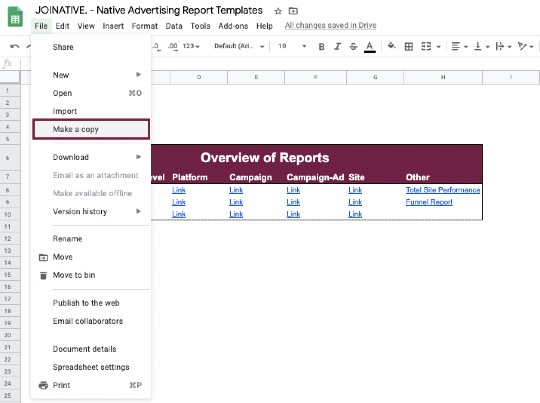
Now, you can work with the copied spreadsheet.
If you haven’t done it yet, export the ad or site report from Native Pro. The platform allows you to export two report types – ad report and site report. We’ll go with the ad report first.
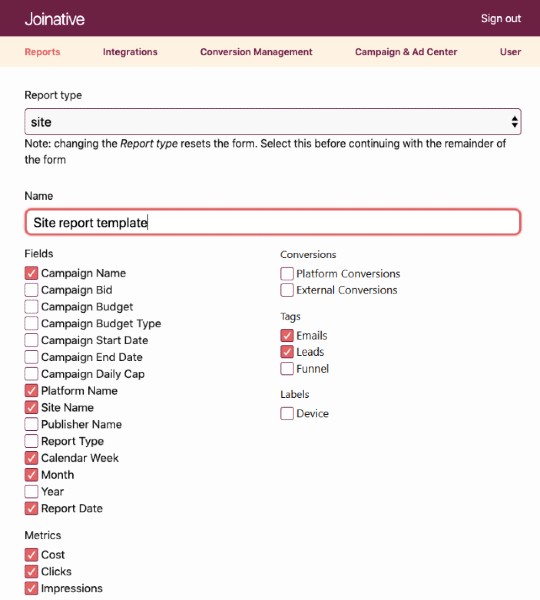
Note: Mind that the order of the columns in your exported report should correspond to the order in the ‘JOINATIVE. Ad Data’ sheet. Otherwise, you’ll need to make some adjustments manually. Thus, when configuring report settings inside of Native Pro, make sure you check exactly the fields and metrics you see in the screenshot below.
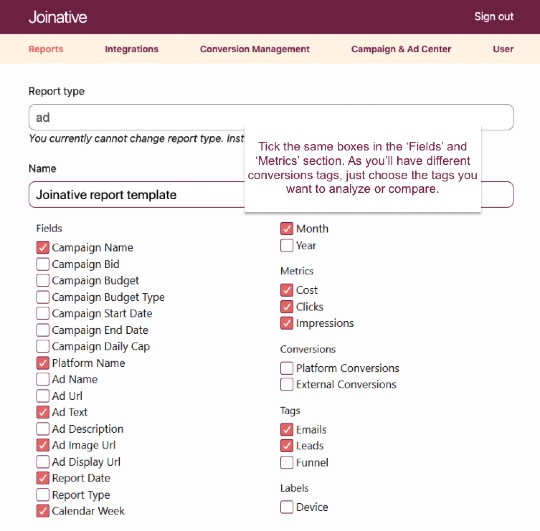
However, you might want to use our Report Templates Collection just as a starting point. You can modify and customize it as you wish. In this case, feel free to add any additional fields but be ready to put extra effort to adjust the formulas.
Export the report, go to the ‘JOINATIVE. Ad Data’ sheet, and upload it replacing the current sheet.
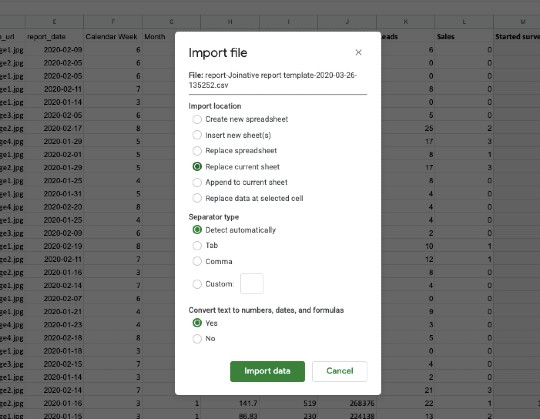
After you replace the default report with your campaign data, you can come back to the INFO section. From here, we’ll start exploring the opportunities our templates give you.
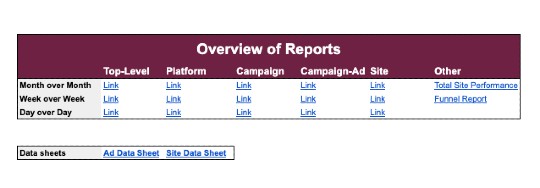
For almost every report template available, you can see the performance data interpreted in three ways – on a month-over-month, week-over-week, or day-over-day basis.
Being able to analyze every report from a different angle is crucial if you want to understand all the processes that are driving the performance of your campaigns.
We won’t describe every report from all three angles in this post, but we’ll demonstrate the ones that, in our opinion, are the most important for an advertiser. Still, depending on your aim, time of the month, amount of data, etc., each of the provided reports can be very helpful.
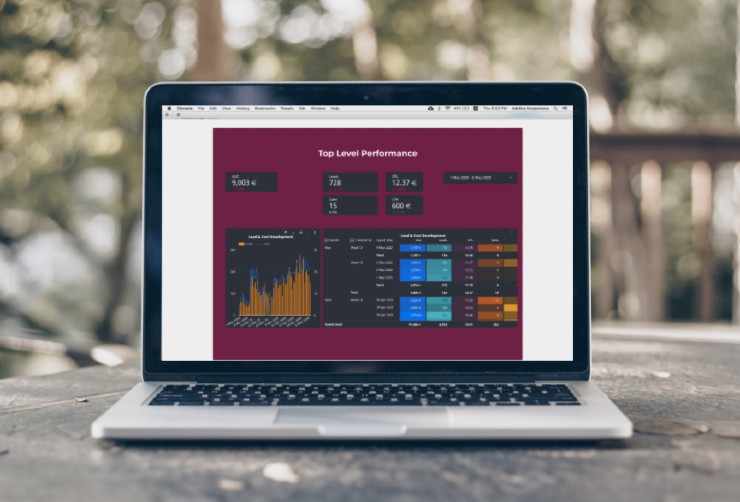
The first thing you might want to check is how all your campaigns were performing in the last few weeks.
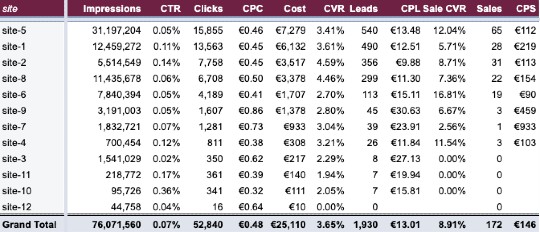
Review overall performance
Important: If no data is shown in the table, check the Filters section in the Pivot table editor. It could be that the rows of your report are filtered out.
We went with the Week over Week Report to evaluate how the optimization efforts we’ve been making for the last few weeks affected the overall performance. For quarterly or yearly reports, our MoM Report will come in very handy.
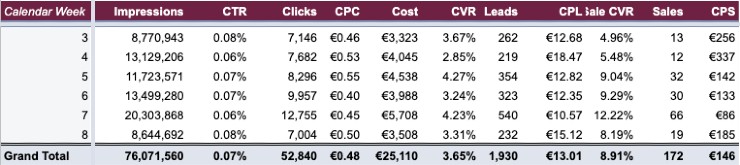
Metrics to pay attention to:
- CVR. What percentage of people clicked on your ads completed the desired action? Which adjustments could cause this rate to change?
- Leads. The number of new leads generated week by week is one of the most crucial KPIs that can tell you whether your native ad campaigns are effective.
- CPL. Lowering your cost-per-lead without affecting lead quality is always a challenge. But if you see a decrease in CPL accompanied by a lift in leads and CVR (as we saw in week 7), you’re on the right track.
- Lead-to-Sale CVR. What’s the percentage of leads that converted? Can the ups and downs be related, for instance, to the targeting options you’ve been testing?
- CPS. Cost per sale is the average amount of money paid by an advertiser to generate one sale. This metric helps you understand whether your campaigns are cost-efficient.
In the WoW Report, you’ll primarily focus on comparing performance metrics over the past week against previous weeks. After you get a general understanding of the overall native advertising performance, you can move on to delve into the more granular reports and understand the underlying causes of the performance drops.
On-Demand Video Course On Native Advertising
Boost your ROAS with native ads. Enroll now with our limited 30% discount.

Compare overall native advertising performance by platform
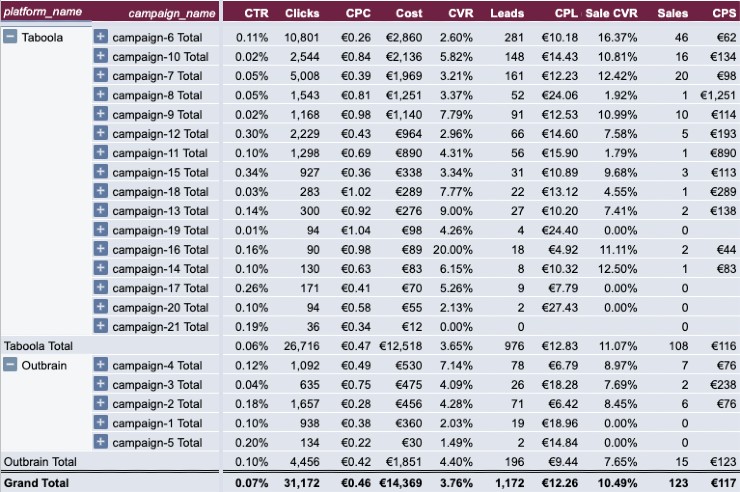
Next, let’s look into the Platform MoM Report.
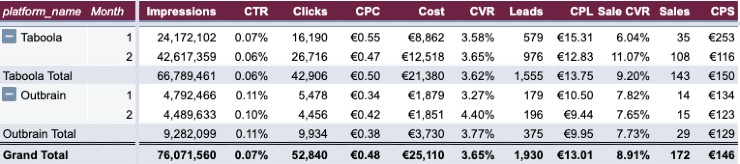
Here you can compare overall native ad campaign performance by platforms for the last few months. This report can tell you whether you need to revisit your budgeting and allocate more on the specific platform.
Campaigns run on Taboola and Outbrain perform differently. You might notice that while one platform delivers better CTR, the other one is much better at delivering audiences that convert into customers. This insight might motivate you to optimize your ads towards the higher CTR inside of one platform lagging behind in this regard and test more granular targeting for the platform that delivers lower CVR.
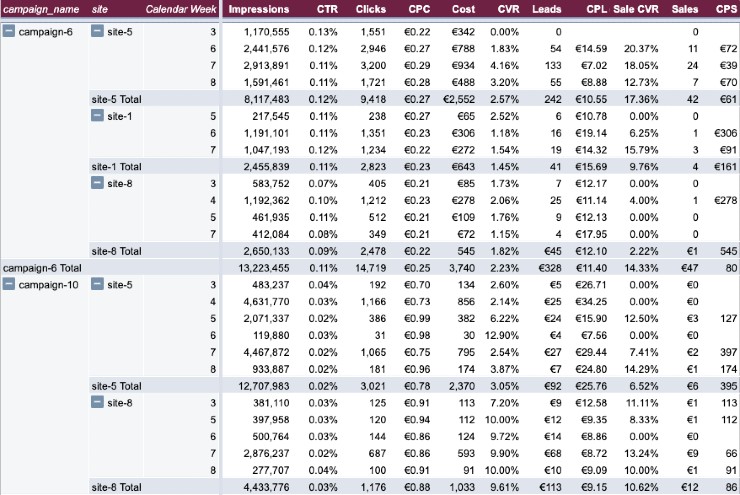
Get comprehensive reports on campaign performance split by platforms
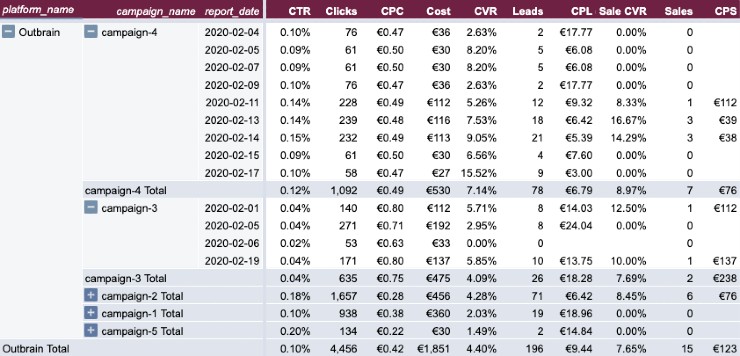
For a better understanding of what happens inside of your campaigns, look at the Campaign DoD Report. This is one of a few reports that should be checked on a daily basis. It allows you to spot any threats and react to them immediately.
Also, if the Platform Report has shown one of the platforms doesn’t perform as well as the other one, you might want to dive into the campaign details for this specific platform right away.
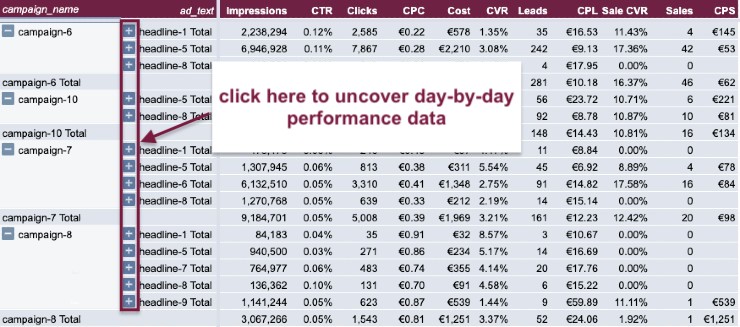
Review the performance of individual ads
Here’s where you get the most granular reporting data. Knowing overall campaign performance metrics isn’t enough. As you’re using different creatives inside of one campaign, it might happen that some of these ads affect the campaign performance significantly.
Exclude sites that waste your budget
To use further reports, you should export one of the site reports from Native Pro. You can either create a new report or go with the existing one, just edit it to match the fields in the example report. Again, you can add as many fields as you wish if you don’t mind fixing the report to make it work with new columns.
Switch to the ‘JOINATIVE. Site Data’ sheet and import the site report following the same pattern described for the ad report.
In the Campaign Site WoW report, you’ll see how your campaigns perform on different websites.
It’s likely that you’ll find websites that deliver a lot of traffic, but these visitors hardly ever convert. If you don’t exclude these placements as soon as possible, you’ll just end up wasting your budget on low-quality clicks. You can either identify these performance issues on the campaign level or just check the overall performance of every website.
If the campaign performance is changing from one week to another, it might be related to the fact your ads are being served on different sites. The Campaign Site WoW Report is where you can figure this out.
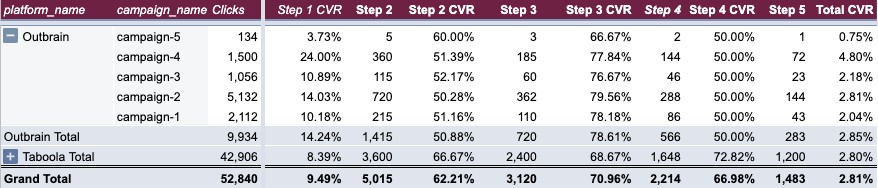
See how your audience converts along the conversion funnel
In our recent post, we’ve already described our unique Conversion Tags feature and how you can create a Pivot table to keep track of every step your campaign clickers make on their way through your conversion funnel. Instead of following the whole Pivot table creation process, you can go with one more report template from our collection.
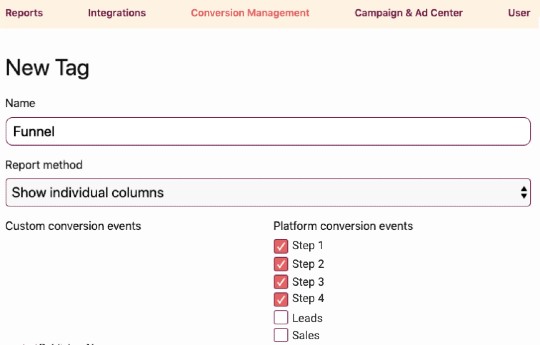
For the funnel steps to be displayed side-by-side in your ad report, you need to create a new conversion tag, assign the relevant conversion events to it (we’ll call it the Funnel tag), and select the ‘Show individual columns’ report method.
Note: Not to open the same report in the worksheet twice, we recommend you to add the Funnel tag to the report template from the very beginning.
Then add this conversion tag to your ad report template, export the report, and follow the pattern of importing the report into the ‘JOINATIVE. Ad Data’ worksheet.
It’s most likely that the number of the funnel steps in the example report will be different from the number of your custom funnel steps. Therefore, you’ll inevitably need to make your changes in the formulas to make them work for you. As you already have an example of ready-to-use funnel report in front of you, adjusting the Pivot table shouldn’t be a problem. When edited in the right way, the report will show you how many people coming from certain campaigns made it to every next step of the conversion funnel.
In every report, we name the columns to illustrate the possible ways of interpreting data. Feel free to change any of them. Don’t be afraid to ‘break’ the report with your actions, you can always come back and make a new copy.
Enjoy the Native Pro Reporting Opportunities
We hope our Native Advertising Reporting Templates will make your routine easier. These templates can facilitate Taboola and Outbrain performance reporting and give you a good starting point for delving deeper into the data and making the most out of it. Do you have any questions regarding Native Pro or the spreadsheet? Drop us a chat message or contact us at hello@joinative.com.
Start your free 30-day trial of Native Pro today and help us shape the features of the tool, while enjoying the opportunities it opens to you.